Friday, January 12 2018, 10:23 am
Calm the hysteria, security patch performance is OK
Unfortunately some bad benchmark data has caused a stir among the greater Internet community. I have chosen to perform my own independent benchmark tests to see if the security patches for Meltdown and Spectre introduce any harm to my everyday life. TL;DR: They don't in the slightest.
The following series of benchmarks are intended to see if desktop PC usage is harmed in any way.
I chose benchmarks of usage I see everyday at my desktop PC. From ffmpeg, to system boot time, to sequential read/write SSD speeds, to synthetic benchmark comparison of bare hardware and a virtual machine, these tests should give a picture if there is any performance delta to be worried about or if I should investigate further with different benchmarks.
Benchmark Setup
- Pre-mitigation: Kernel 4.14.8 and old microcode
- Post-mitigation: Kernel 4.14.13 and 2018 microcode
- CPU: Intel Core i7 4790k
- SSD: Samsung 850 Pro 1TB
FFmpeg
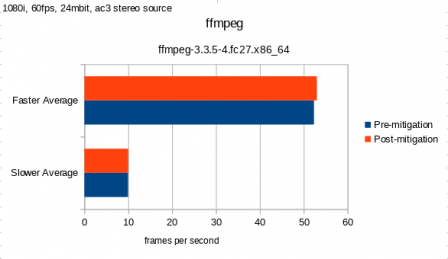
The source material is some footage from my Canon HFS100 camcorder. It records a 1080i 60 fps video feed at 24Mb per second. I routed the output to /dev/null so these tests only test hard drive reads, CPU, and RAM throughput. There was no discernible difference in encoding speed. In fact I felt there was a small (<1%) performance boost with the post-mitigation setup, but you cannot see it in the results.
- Faster: -c:v libx264 -c:a flac -preset faster -crf 23 -f matroska -t 00:01:00
- Slower: -c:v libx264 -c:a flac -preset slower -crf 21 -f matroska -t 00:01:00
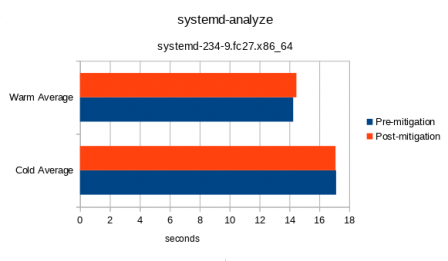
System Bootup
There was also no discernible difference in boot time. There are many moving pieces, from file I/O, to the kernel loading drivers, and user-space daemons loading, and none of that was effected by the security updates.
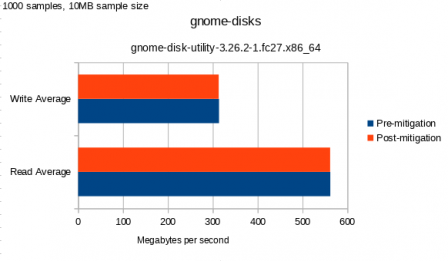
Sequential Read and Write
Again, no difference. I used the Gnome Disks tool. Very basic, sure, but if I were to see any significant dip I would run a more intensive test using a different tool.
Bare Hardware vs VirtualBox
Almost every day I use a virtual machine with Windows because of a specific software requirement for either my job or my hobbies. There are very few cross-platform benchmarks so I used the first Google result - Geekbench. The VM is set to 1 CPU, 4 GB RAM so the multi-core tests won't be very accurate, but I've included it anyway. VirtualBox 5.2.2 and a Windows 8.1 guest patched up to Nov. 2017 was used for this test.
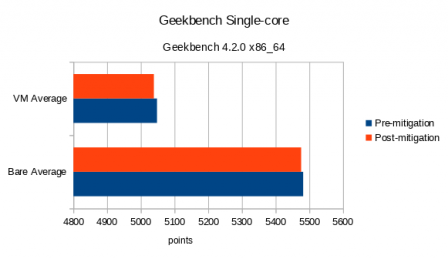
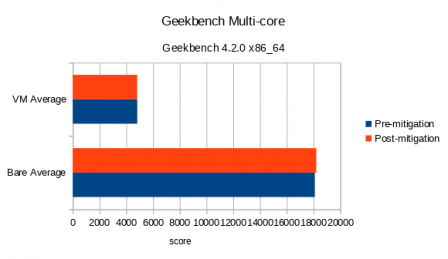
All of the above tests were performed 3 times per test and averaged into charts.
One interesting note I will end with: The kernel now consumes an additional ~3MB of RAM.
- 4.14.8: (8990K kernel code, 1538K rwdata, 3724K rodata, 2060K init, 1380K bss, 444228K reserved, 0K cma-reserved)
- 4.14.13: (12300K kernel code, 1546K rwdata, 3728K rodata, 2108K init, 1364K bss, 448600K reserved, 0K cma-reserved)